![[header text image]](img/header/img-hdr-ar-2011-2012.jpg "Annual Report 2010-2011")

Appendix A – Additional caseload statistics
This appendix presents additional statistical information regarding the MRT and RRT caseloads.
| 2012-13 | 2011-12 | 2010-11 | % change 2011-12 to 2012-13 | |
|---|---|---|---|---|
| MRT | ||||
| Visa refusal – Bridging | 342 | 267 | 264 | +28% |
| Visa refusal – Visitor | 942 | 944 | 920 | 0% |
| Visa refusal – Student | 3,454 | 3,820 | 3,138 | -10% |
| Visa refusal – Temporary work* | 1,038 | 634 | 621 | +64% |
| Visa refusal – Permanent business | 1,143 | 806 | 661 | +42% |
| Visa refusal – Skilled | 4,326 | 3,606 | 635 | +20% |
| Visa refusal – Partner | 1,855 | 1,345 | 1,348 | +38% |
| Visa refusal – Family | 1,174 | 727 | 672 | +61% |
| Cancellation – Student | 727 | 1,043 | 1,107 | -30% |
| Nomination/Sponsor approval refusal | 696 | 516 | 513 | +35% |
| Other | 467 | 380 | 436 | +23% |
| Total MRT | 16,164 | 14,088 | 10,315 | +15% |
| RRT | ||||
| Sri Lanka | 701 | 65 | 75 | +978% |
| China | 610 | 689 | 819 | -11% |
| Afghanistan | 513 | 44 | 19 | +1,066% |
| India | 434 | 435 | 221 | 0% |
| Pakistan | 332 | 312 | 102 | +6% |
| Iran | 232 | 107 | 58 | +117% |
| Lebanon | 206 | 94 | 125 | +119% |
| Nepal | 124 | 184 | 107 | -33% |
| Egypt | 104 | 185 | 181 | -44% |
| Fiji | 98 | 130 | 252 | -25% |
| Other | 875 | 960 | 1,007 | -9% |
| Total RRT | 4,229 | 3,205 | 2,966 | +32% |
| Total MRT and RRT | 20,393 | 17,293 | 13,281 | +18% |
*In 2012-13, the MRT case category ‘Visa Refusal – Temporary business’ changed to ‘Visa Refusal – Temporary work’. This was a result of the changes made to the Migration Regulations. In 2011-12, the MRT ‘Sponsor approval refusal’ and ‘other’ case categories changed. Nomination approval refusals were removed from the ‘other’ case category and added in to the ‘sponsor approval refusal’ category. These changes have been applied to statistical data for all 3 years and may vary from data in previous annual reports.
Figure 7 – MRT lodgements, decisions and cases on hand by quarter
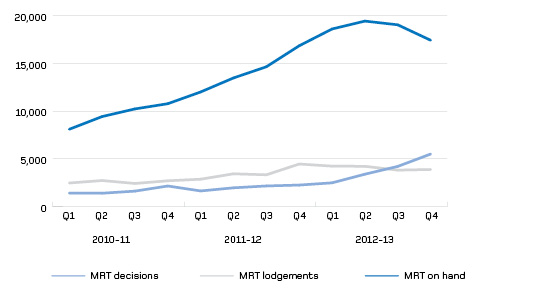
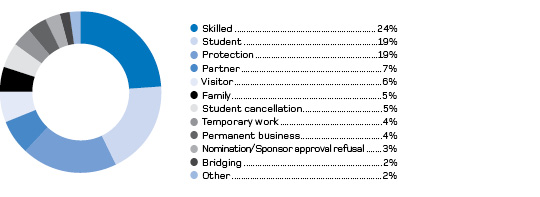
Figure 8 – MRT and RRT cases on hand AS at 30 June 2013
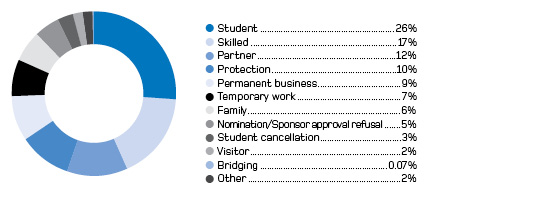
Figure 9 – RRT lodgements, decisions and cases on hand by quarter
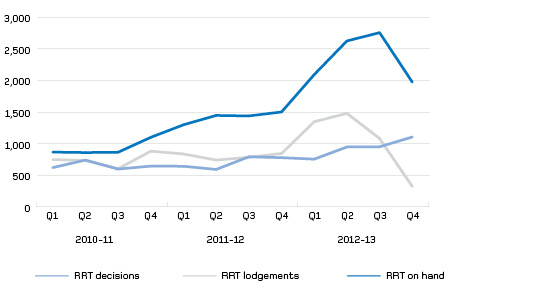
Figure 10 – MRT and RRT decisions
| 2012-13 | 2011-12 | 2010-11 | |
|---|---|---|---|
| MRT | |||
| Visa refusal – Bridging | 14 | 12 | 9 |
| Visa refusal – Visitor | 458 | 607 | 357 |
| Visa refusal – Student | 5,032 | 5,203 | 3,716 |
| Visa refusal – Temporary work | 1,274 | 989 | 911 |
| Visa refusal – Permanent business | 1,789 | 1,415 | 841 |
| Visa refusal – Skilled | 3,302 | 3,555 | 711 |
| Visa refusal – Partner | 2,398 | 1,968 | 1,731 |
| Visa refusal – Family | 1,199 | 1,003 | 833 |
| Cancellation – Student | 621 | 811 | 600 |
| Nomination/Sponsor approval refusal | 1,013 | 917 | 741 |
| Other | 337 | 383 | 336 |
| Total MRT | 17,437 | 16,863 | 10,786 |
| RRT | |||
| Sri Lanka | 314 | 34 | 36 |
| China | 350 | 303 | 279 |
| Afghanistan | 58 | 39 | 7 |
| India | 170 | 174 | 80 |
| Pakistan | 212 | 210 | 59 |
| Iran | 73 | 55 | 19 |
| Lebanon | 136 | 46 | 49 |
| Nepal | 103 | 89 | 56 |
| Egypt | 74 | 81 | 112 |
| Fiji | 58 | 61 | 64 |
| Other | 425 | 409 | 339 |
| Total RRT | 1,973 | 1,501 | 1,100 |
| Total MRT and RRT | 19,410 | 18,364 | 11,886 |
| 2012-13 | 2011-12 | 2010-11 | |
|---|---|---|---|
| Average time taken (days)* | |||
| Bridging visa (detention) refusals (MRT) | 6 | 7 | 7 |
| Visa cancellations (MRT) | 342 | 224 | 150 |
| All other MRT visa refusals | 421 | 461 | 337 |
| Protection visa refusals | 159 | 149 | 99 |
| Percentage decided within time standards* | |||
| Bridging visa (detention) refusals (MRT) – seven working days | 96% | 95% | 96% |
| Visa cancellations (MRT) – 150 calendar days | 12% | 22% | 60% |
| All other MRT visa refusals – 350 calendar days | 47% | 42% | 55% |
| Protection visa refusals – 90 calendar days | 30% | 32% | 71% |
* Calendar days, other than for bridging (detention) cases, where working days are used. Time standards are as set out in the Migration Act and Migration Regulations or in the 2012-13 Portfolio Budget Statement. For MRT cases, time taken is calculated from date of lodgement. For RRT cases, time taken is calculated from the date the department’s documents are provided to the RRT. The average time from lodgement of an application for review to receipt of the department’s documents was 24 days for MRT cases and seven days for RRT cases.
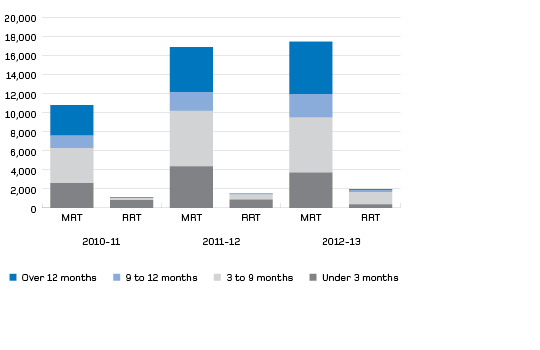
Figure 11 – Number and age of cases on hand
| 2012-13 | 2011-12 | 2010-11 | |
|---|---|---|---|
| MRT | |||
| Primary decision set-aside or remitted | 4,514 | 2,912 | 2,728 |
| Primary decision affirmed | 7,121 | 3,133 | 2,356 |
| Application withdrawn by applicant | 2,661 | 1,180 | 754 |
| No jurisdiction to review* | 1,294 | 786 | 739 |
| Total | 15,590 | 8,011 | 6,577 |
| RRT | |||
| Primary decision set-aside or remitted | 1,372 | 750 | 626 |
| Primary decision affirmed | 2,205 | 1,899 | 1,815 |
| Application withdrawn by applicant | 86 | 86 | 53 |
| No jurisdiction to review* | 94 | 69 | 110 |
| Total | 3,757 | 2,804 | 2,604 |
* No jurisdiction decisions include applications not made within the prescribed time limit, not made in respect of reviewable decisions or not made by a person with standing to apply for review.
| 2012-13 | 2011-12 | 2010-11 | ||||
|---|---|---|---|---|---|---|
| Cases | % set-aside | Cases | % set-aside | Cases | % set-aside | |
| MRT | ||||||
| Visa refusal – Bridging | 340 | 15% | 264 | 12% | 267 | 12% |
| Visa refusal – Visitor | 1,090 | 56% | 695 | 65% | 752 | 59% |
| Visa refusal – Student | 3,631 | 23% | 2,334 | 31% | 1,320 | 36% |
| Visa refusal – Temporary work | 852 | 24% | 556 | 26% | 355 | 25% |
| Visa refusal – Permanent business | 767 | 35% | 233 | 29% | 148 | 32% |
| Visa refusal – Skilled | 4,576 | 23% | 762 | 36% | 958 | 53% |
| Visa refusal – Partner | 1,426 | 53% | 1,108 | 55% | 937 | 62% |
| Visa refusal – Family | 978 | 41% | 557 | 44% | 471 | 39% |
| Cancellation – Student | 917 | 13% | 833 | 21% | 796 | 25% |
| Nomination/Sponsor approval refusal | 606 | 23% | 340 | 15% | 214 | 24% |
| Other | 407 | 29% | 329 | 43% | 359 | 33% |
| Total MRT | 15,590 | 29% | 8,011 | 36% | 6,577 | 41% |
| RRT | ||||||
| Sri Lanka | 421 | 37% | 67 | 28% | 56 | 59% |
| China | 564 | 18% | 665 | 17% | 759 | 22% |
| Afghanistan | 494 | 84% | 12 | 75% | 15 | 73% |
| India | 438 | 6% | 343 | 6% | 181 | 7% |
| Pakistan | 330 | 65% | 161 | 50% | 59 | 36% |
| Iran | 214 | 61% | 71 | 80% | 51 | 76% |
| Lebanon | 116 | 26% | 99 | 41% | 95 | 31% |
| Nepal | 110 | 6% | 151 | 9% | 64 | 16% |
| Egypt | 110 | 49% | 216 | 61% | 87 | 36% |
| Fiji | 101 | 13% | 133 | 20% | 318 | 13% |
| Other | 859 | 26% | 886 | 27% | 919 | 25% |
| Total RRT | 3,757 | 37% | 2,804 | 27% | 2,604 | 24% |
| Total MRT and RRT | 19,347 | 30% | 10,815 | 34% | 9,181 | 37% |
![]()