

Appendix A – Additional caseload statistics
This appendix presents additional statistical information regarding the MRT and RRT caseloads.
| 2013–14 | 2012–13 | 2011–12 | % change 2012–13 to 2013–14 | |
|---|---|---|---|---|
| MRT | ||||
| Visa refusal – Bridging | 407 | 356 | 276 | +14% |
| Visa refusal – Visitor* | 1,507 | 1,204 | 1,026 | +25% |
| Visa refusal – Student | 2,854 | 3,456 | 3,824 | -17% |
| Visa refusal – Temporary work | 1,507 | 1,047 | 745 | +44% |
| Visa refusal – Permanent business | 1,116 | 1,163 | 811 | -4% |
| Visa refusal – Skilled | 2,127 | 4,341 | 3,619 | -51% |
| Visa refusal – Partner | 3,154 | 1,865 | 1,361 | +69% |
| Visa refusal – Family | 885 | 1,175 | 727 | -25% |
| Cancellation – Student | 593 | 726 | 1,043 | -18% |
| Nomination/Sponsor approval refusal | 1,121 | 719 | 534 | +56% |
| Other* | 155 | 112 | 122 | +38% |
| Total MRT | 15,426 | 16,164 | 14,088 | -5% |
| RRT | ||||
| Sri Lanka | 1,644 | 701 | 65 | +135% |
| China | 900 | 610 | 689 | +48% |
| Afghanistan | 651 | 513 | 44 | +27% |
| India | 575 | 434 | 435 | +32% |
| Pakistan | 534 | 332 | 312 | +61% |
| Iran | 510 | 232 | 107 | +120% |
| Egypt | 203 | 104 | 185 | +95% |
| Lebanon | 196 | 206 | 94 | -5% |
| Fiji | 186 | 98 | 130 | +90% |
| Nepal | 174 | 124 | 184 | +40% |
| Other | 1,290 | 875 | 960 | +48% |
| Total RRT | 6,863 | 4,229 | 3,205 | +62% |
| Total MRT and RRT | 22,289 | 20,393 | 17,293 | +9% |
*In 2013–14, the composition of the MRT ‘other’ and ‘visitor’ case categories changed. Visa cancellations were moved from the ‘other’ case category in to their respective case categories (e.g. partner visa cancellations moved from ‘other’ to the ‘partner’ case category). Subclass 417 (Working Holiday) visa reviews were removed from the ‘other’ case category to the ‘visitor’ case category. These changes have been applied to the statistical data for previous years in this report. As a result, MRT caseload category data for 2011–12 and 2012–13 in this report will vary from data included in previous annual reports.
Figure 8 – MRT lodgements, decisions and cases on hand by quarter
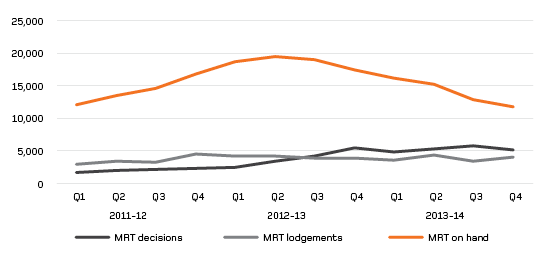
Figure 9 – RRT lodgements, decisions and cases on hand by quarter
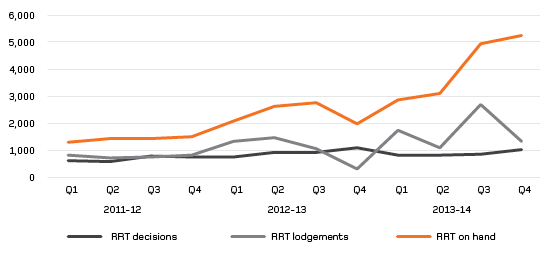
Figure 10 – MRT and RRT decisions
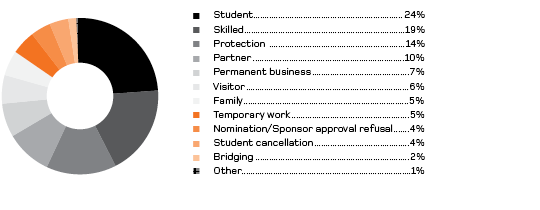
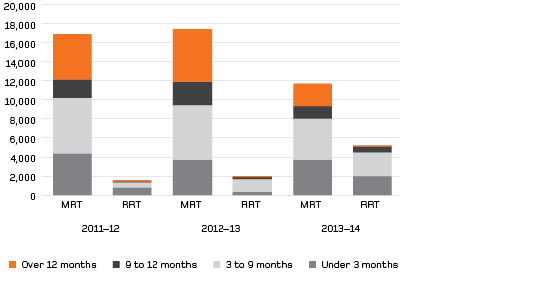
Figure 11 – Number and age of cases on hand
| 2013–14 | 2012–13 | 2011–12 | |
|---|---|---|---|
| MRT | |||
| Visa refusal – Bridging | 13 | 16 | 15 |
| Visa refusal – Visitor | 661 | 615 | 630 |
| Visa refusal – Student | 1,994 | 5,036 | 5,209 |
| Visa refusal – Temporary work | 1,572 | 1,285 | 1,109 |
| Visa refusal – Permanent business | 1,206 | 1,811 | 1,419 |
| Visa refusal – Skilled | 841 | 3,325 | 3,566 |
| Visa refusal – Partner | 3,211 | 2,412 | 1,980 |
| Visa refusal – Family | 795 | 1,200 | 1,003 |
| Cancellation – Student | 245 | 621 | 811 |
| Nomination/Sponsor approval refusal | 1,132 | 1,038 | 938 |
| Other | 49 | 78 | 183 |
| Total MRT | 11,719 | 17,437 | 16,863 |
| RRT | |||
| Sri Lanka | 1,555 | 314 | 34 |
| China | 506 | 350 | 303 |
| Afghanistan | 603 | 58 | 39 |
| India | 302 | 170 | 174 |
| Pakistan | 432 | 212 | 210 |
| Iran | 413 | 73 | 55 |
| Egypt | 175 | 74 | 81 |
| Lebanon | 128 | 136 | 46 |
| Fiji | 134 | 58 | 61 |
| Nepal | 102 | 103 | 89 |
| Other | 901 | 425 | 409 |
| Total RRT | 5,251 | 1,973 | 1,501 |
| Total MRT and RRT | 16,970 | 19,410 | 18,364 |
| 2013–14 | 2012–13 | 2011–12 | ||||
|---|---|---|---|---|---|---|
| Cases | % set-aside | Cases | % set-aside | Cases | % set-aside | |
| MRT | ||||||
| Visa refusal – Bridging | 410 | 11% | 355 | 14% | 271 | 13% |
| Visa refusal – Visitor | 1,461 | 51% | 1,219 | 55% | 782 | 64% |
| Visa refusal – Student | 5,896 | 26% | 3,629 | 23% | 2,333 | 31% |
| Visa refusal – Temporary work | 1,220 | 22% | 871 | 24% | 636 | 27% |
| Visa refusal – Permanent business | 1,721 | 38% | 771 | 35% | 236 | 30% |
| Visa refusal – Skilled | 4,611 | 22% | 4,582 | 23% | 776 | 37% |
| Visa refusal – Partner | 2,355 | 45% | 1,433 | 52% | 1,119 | 55% |
| Visa refusal - Family | 1,290 | 36% | 978 | 41% | 557 | 44% |
| Cancellation – Student | 969 | 17% | 916 | 13% | 834 | 21% |
| Nomination/Sponsor approval refusal | 1,027 | 34% | 619 | 23% | 346 | 16% |
| Other | 184 | 21% | 217 | 17% | 329 | 40% |
| Total MRT | 21,144 | 30% | 15,590 | 29% | 8,011 | 36% |
| RRT | ||||||
| Sri Lanka | 402 | 22% | 421 | 37% | 67 | 28% |
| China | 744 | 10% | 564 | 18% | 665 | 17% |
| Afghanistan | 106 | 72% | 494 | 84% | 12 | 75% |
| India | 443 | 7% | 438 | 6% | 343 | 6% |
| Pakistan | 314 | 41% | 330 | 65% | 161 | 50% |
| Iran | 170 | 59% | 214 | 61% | 71 | 80% |
| Egypt | 101 | 33% | 110 | 49% | 216 | 61% |
| Lebanon | 205 | 17% | 116 | 26% | 99 | 41% |
| Fiji | 113 | 10% | 101 | 13% | 133 | 20% |
| Nepal | 175 | 4% | 110 | 6% | 151 | 9% |
| Other | 812 | 23% | 859 | 26% | 886 | 27% |
| Total RRT | 3,585 | 22% | 3,757 | 37% | 2,804 | 27% |
| Total MRT and RRT | 24,729 | 29% | 19,347 | 30% | 10,815 | 34% |
![]()